Sunday, February 05, 2012

FII INVESTMENTS...INFLOW!!!!

THE FII- INFLOW... A WELCOME...A CONSOLIDATION.....


DATE
BUY
SELL
NET FII INVESTMENT
02-Feb-2012
5,124.80
2,989.90
2,134.90 
01-Feb-2012
5,227.20
3,134.50
2,092.70 
31-Jan-2012
3,459.70
2,814.60
645.10 
30-Jan-2012
2,577.60
2,657.20
-79.60 
27-Jan-2012
4,096.00
2,731.80
1,364.20 
25-Jan-2012
3,890.50
2,718.30
1,172.20 
24-Jan-2012
2,997.70
2,088.50
909.20 
23-Jan-2012
1,564.80
1,577.60
-12.80 
20-Jan-2012
3,547.00
2,549.80
997.20 
19-Jan-2012
2,822.60
2,125.00
697.60 
18-Jan-2012
3,002.40
2,041.10
961.30 
17-Jan-2012
2,975.90
1,911.40
1,064.50 
16-Jan-2012
1,990.50
1,543.20
447.30 
13-Jan-2012
2,526.30
2,161.70
364.60 
12-Jan-2012
2,526.80
2,001.30
525.50 
11-Jan-2012
2,629.60
2,132.10
497.50 
10-Jan-2012
2,783.10
2,378.00
405.10 
09-Jan-2012
1,789.10
1,776.70
12.40 
06-Jan-2012
1,851.00
1,825.90
25.10 
05-Jan-2012
2,248.40
1,699.20
549.20 
04-Jan-2012
1,840.30
1,583.10
257.20 
03-Jan-2012
1,356.50
1,030.90
325.60 
02-Jan-2012
472.30
511.40
-39.10 

Wkly Tech Analysis Nifty has broken past major hurdles
Rex Cano / Mumbai Feb 05, 2012, 00:14 IST

The markets continued to rally for yet another week, driven by liquidity. The Foreign Institutional Investors (FIIs) so far this year have pumped in over Rs 15,000 crore. The Sensex, which, witnessed some choppiness in the first half of the week, rallied firmly in the latter half as FIIs stepped up the buying.
The BSE benchmark index rallied to a high of 17,630, and finally settled with a gain of over two per cent at 17,605. In the process, the Sensex has around 13.5 per cent so far in this calendar year.
Among the Sensex stocks this week, DLF zoomed nearly 9 per cent to Rs 230. Tata Power, Hero MotoCorp, Hindalco, TCS, Sun Pharma, Jindal Steel, Gail India, HDFC Bank and Bajaj Auto were up 5-8 per cent each. On the other hand, Coal India, BHEL and Larsen & Toubro were the major losers.
Last week, the Sensex gave a positive breakout on the quarterly charts, and now has crossed its first major hurdle of 17,565 on the yearly charts. This indicates further bullishness for the markets. Now, the overall trend for the markets is likely to remain up as long as the Sensex trades above 16,500-16,600. The immediate support for the index would be around 17,170.
As per the monthly Fibonacci charts, the Sensex may now target 17,920 in the short-term, while face resistance around 18,150-18,370 on the upside. The NSE Nifty moved in a range of 258 points, the index from a low of 5,077 surged to a high of 5,335. The index ended with a gain of 2.3 per cent at 5,326.
The Nifty has now cleared two major hurdles in form of the 50-WMA and 200-DMA. The index has now settled above the 200-day DMA (Daily Moving Average) for three successive days, which now strengthens the up move. The index has also closed above the 50-WMA (Weekly Moving Average) - which is at 5,255. The 200-day DMA, at 5,190, and the 50-WMA will now act as an immediate support for the index.
The momentum oscillators continue to remain bullish on both the daily and the weekly charts. Hence, one should expect fresh buying on dips. The upside resistance for the Nifty could be around 5,370-5,400. Next week, the Nifty can rally to 5,425-5,485 on the upside, while may seek support around 5,225-5,165 on the lower side.

THANKS TO B S

GOOD OBSERVATION


----------------------------------PLEASE READ ONE OF THE GOOD OBSERVATION FROM MASTER.........

Here are my observations for your last post and the markets. Markets will go lower when everyone are least expecting it not when people were talking about 4200 and 3900 possibilities. Also Markets lead the data by 2 to 3 quarters in advance. That said 4530 in the last quarter of December was reflecting the earnings data of Q1/Q2 2012 results.

Amount of money being pumped by Obama's administration will keep the markets afloat as you rightly pointed out as 40 nations across the globe are going for polls this year.

2013 and 2014 years seems to be heading to rough patch and we will be seeing huge downfalls in the market in 2014 like what we had in 2008. Temporary fixes in the markets wont help like what all the central banks in the world did back in 2008 by pumping in more liquidity. It has to stop somewhere and looks like a reset to all the developed economies is bound to happen in next 2 to 3 years which would lead to the era of chinese,brazilian and indian economies dominating the 21st century bull run.

Please share your valuable thoughts. 

One simple word "Mass Psychology" is the tool all the smart investors across the globe have in their kitty. Fundamental and technical analysis are the tools they use to manipulate the markets in the direction they want.

RajeshMuppaneni

-------------------------------------------------------
Masterji,
 

Good post.
The approach is very good but economic indicators needs to be included

B.NageswaraRao

Saturday, February 04, 2012

THE PAST FOR FUTURE......RE-LOOK

IN MY EARLIER POST......SAID----the market as whole looks gloomy but that is not the true colour!!!!.....  THERE ARE PEOPLE WHO MADE LOTS OF MONEY DURING THE UP MOVE AND MANY MORE INTELLIGENTS AND PUNDITS BURNT THEIR FINGERS-----IS ALL EXPERIENCE FOR THOSE WHO LOST AND ALSO A REINFORCEMENT TO THOSE WHO MADE MONEY....??????
Lower level buying...dated--09-10-2011
The markets are rejoiced with the bottom support at 4700 level despite of the sharp fall in the European markets in the early this weak. The regular readers might have noticed that the world markets are in bull grip except the Japan market-Nikkei. The best out performed and the recent barometer is the DAX. The Germany has given best returns to investors and it had even strong support at 5000 level. The DAX bounced from that level with vengeance and the bulls are confident of their returns over longer period of holding.

The US market though struggling to revive on the prospects of economy getting stimulated by the federal infusions. The banks few years back are worst scrips now quoting decent prices based on their asset quality. Now these banks even do better with the reviving of the real-estate and consumer demand. The down grade of Moody’s ratings is a caution but not necessarily an indication of crippling/sinking economy. The best barometer is the stock market. The S&P is still quoting close to 1180 still above the 1050 support level.


 The Nifty is trading in the lower range of the 4700-5700 band, struggling to stay above 4930, has become a herculean task. The Nifty may touch 5280 level to trap both the short sellers at 4700 level and buyers above 5180 level is a likely scenario for NEXT 6 months. The Dollar appreciation (in my opinion a sponsored programme) helped the exporters to especially the soft ware service sector and to invite more FDI in to India, supported for the rise in the software stocks and likely to rise further. The Infy did not touch the 1900 level as anticipated when it started falling from 2700 level. Now in the changed economic environment, current move likely to touch 2700 level in future.The Banking sector which was attracted all bad news in recent time likely to under performs and will see lower levels. The downgrade of SBI will add fuel to the fire. The temporary relief in the ICICI and Axis shall be used to short at higher level. The earning season starts from Infy to focus on scrip based performance in the bourses. The focused approach will provide opportunity to gain from the results based moves. The Govt is likely to announce following the lead provided by the UK stimulus move. The FMGC sector, the outperforming sector likely to join the draggers list due to the inflation based tightening of the liquidity. The future growth in the indices can be tracked once Nifty touches and bounces from 4400-4500 level. The commodity stocks will gain the buying support as the cycle likely to see a silver-lining.


THE BOTTOMS ARE BUILDINGS!!!!! dated--07-01-2012

The Nifty is in a very narrow band. I posted the same in my earlier posts.The markets are in a sense building the bottom. The strength in the market is intact. The Nifty is getting support at 4700 level.
During my personal interaction, people are interested to buy large caps because of the liquidity. They wanted to invest 2-5 lakhs in one go. Where the tiny stocks which multiply by 5-10 time need separate patience to acquire. The SIP- Systematic Investment Plan is a model known to many market participants. The SIP term is a popular one but a coined a word like -KoI-Keep on Investing with Knowledge of Investment.

The multi-baggers are not possible with large cap and mid cap stocks. The small caps take the advantage of becoming large. The tiny stocks though look weak on fundamentals but they takeoff like fire. It is very difficult to identify such stocks but the small cap universe is quite large.
During my recent discussions, I suggested friends to buy Relcap rather than SBI, since then it gave a 30% return and it has much more potential stored in. The insurance business will give good valuation in coming months. This a sector having very bright future apart from the infra structure.

the market fall from the current levels are very good for long-term investors who can build their portfolio over a period of 12 months. The best case to start buying the value stocks from 4400 level Nifty touches.
The RIL likely to touch 620 level and it may touch 550-585 level but the market as whole looks gloomy but that is not the true colour!!!!.....

Friday, February 03, 2012

Investors worry--CRISIS not OVER

Investors worry where to put cash as banks wobble
By Chris Vellacott


LONDON
Fri Feb 3, 2012 5:59pm IST

LONDON (Reuters) - Investors are holding more cash than at any time since the Lehman Brothers collapse to protect themselves against volatile financial markets, presenting them with a dilemma - where to hold that money when banks are looking shaky.
When the European Central Bank stepped up efforts to provide liquidity to banks in late 2011, financial markets settled down and the chances of a catastrophe scenario, in which banks fail and depositors lose their money, became more remote.
But investors are still mindful that the unthinkable, while highly unlikely, is not impossible, giving pause for thought to institutions and wealthy individuals with sums too large to be covered by existing compensation schemes.
A monthly survey of British investment managers showed in December cash holdings were at their highest for more than two years, prompted by worries over the euro crisis.
The panic about bank solvency has not yet reached the levels seen in the wake of the collapse of Lehman Brothers four years ago, investors said. One senior private banker said at the height of the post Lehman turmoil in 2009, a "particularly eccentric" rich client had enquired about putting large amounts of their wealth in gold and then burying it on their land.
But closer scrutiny of counterparty risks by investors is currently leading to more use of alternatives to bank deposits like short-dated debt issued by AAA-rated governments or cash-like instruments such as money market funds.
"It's a small chance it'll happen but it's big enough that we think there's no point in looking for a few extra basis points (of investment performance) for taking the risk," said William Drake, co-founder of London-based investment manager Lord North Street.
Drake said the firm favours putting more money in short- dated UK government bonds as an alternative to deposits in a bank, while the crisis continues.
"We think you should be absolutely sure you are going to get 100 pence back out of every pound you put in." he said.
Britain's Financial Services Compensation Scheme guarantees recovery of up to 85,000 pounds per person if a bank fails, protecting the savings of most people but falling short of the amounts deposited by rich investors or institutions.
David Scott, chief executive of London-based upmarket investment manager Vestra Wealth, favours parking clients' cash in UK banks that were bailed out by the government during the earlier crisis of 2008 to 2009.
Royal Bank of Scotland (RBS.L) is 83 percent owned by the British government following a state bailout during the 2008 credit crisis, while Lloyds Banking Group (LLOY.L) is 40 percent state owned.
Having stopped people losing their savings once, the British government is likely to do it again should the need arise, Scott argues."There's no way the UK government will let a high street bank go," he said.
Xenfin Capital, a London-based hedge fund trades using a small amount of the capital it holds for its clients, mostly very rich private investors, placing the rest on deposit at cooperatively-owned Dutch lender Rabobank RABO.UL.
Unlike its main Dutch rivals ABN AMRO ABNNV.UL and ING Group (ING.AS), Rabobank did not need state aid during the 2008 credit crisis.
"We use Rabobank as a counterparty due to their high credit standing, and due to the fact that the London FX Prime Broking desk only deals in spot FX, and has no exposure to more exotic instruments," said Nick Hocart, head of business development at Xenfin.
Many of the investors contacted by Reuters said they are less nervous now about the chances of financial catastrophe than they were during 2008-2009.
Efforts by monetary authorities late in 2011 to provide liquidity to struggling European banks are widely seen as evidence of firm political will to avert collapse, said Rob Burgeman, a divisional director at investment manager Brewin Dolphin (BRW.L), who sits on the asset allocation committee.
"You have to do your due diligence but at the same time if you are with a basket of blue chip banks it is inconceivable that the world will watch this go to hell in a handcart," he said.
But four years of financial crisis and extreme events like Lehman Brothers have undermined assumptions about banks and led to long term shifts in attitudes about how to manage cash, said Frances Hudson, global strategist at Standard Life Investments.
"Lehmans started counterparty risk awareness and that'll be a lesson that will stay with us for some time," she said.
"One would hope things would ease at some point but there's still a credibility deficit from governments and from the banking system."

Wednesday, February 01, 2012


Per capita income crosses Rs 50,000 for first time in 2010-11

PTI, 31 Jan 2012 | 06:22 PM
"The per capita income at current prices is estimated at Rs 53,331 in 2010-11, as against Rs 46,117 for the previous year, depicting a growth of 15.6 per cent," said the Quick Estimates of National Income released by the Central Statistical Office (CSO).
Reflecting growing prosperity, India's per capita income grew by 15.6 per cent to Rs 53,331 per annum in 2010-11, crossing the half-a-lakh rupees mark for the first time, according to government data.

"The per capita income at current prices is estimated at Rs 53,331 in 2010-11, as against Rs 46,117 for the previous year, depicting a growth of 15.6 per cent," said the Quick Estimates of National Income released by the Central Statistical Office (CSO).

The growth in per capita income comes on the back of 8.4 per cent expansion of the Indian economy during the last fiscal.
Per capita income is the earnings of each Indian if the national income is evenly divided among the country's population of around 120 crore. It is an important indicator of overall prosperity in the country.

However, the increase in per capita income at constant (2004-05) prices, after discounting for inflation, was about 6.4 per cent in 2010-11. It was Rs 35,993 in 2010-11, as against Rs 33,843 in the previous year.

According to the figures, the size of the economy at current prices rose to Rs 71,57,412 crore last fiscal, up 17.5 per cent from Rs 60,91,485 crore in 2009-10.

Based on 2004-05 prices, the Indian economy expanded by 8.4 per cent during the fiscal ended March, 2011.

The GDP at constant (2004-05) prices in 2010-11 has been estimated at Rs 48,85,954 crore, as against Rs 45,07,637 crore in 2009-10, as per the Quick Estimates.

The rate of growth in the 2009-10 fiscal stood at 8.4 per cent, as per provisional estimates which were also released today.

Saturday, January 28, 2012

PLAN YOUR BET ON STOCKMARKETS....

Wednesday November 23, 2011
Political parties and stock returns by Sy Harding, editor Street Smart Report
The lead-up to next year’s election will bring a lot of claims from both parties. So we looked at the record over 50 and 100 years to see which political party in the White House is historically better for stocks.
I thought I’d check the historical record to make sure I don’t fall into the ‘lazy trap’ of repeating popular beliefs as fact when they might not be. I was more than mildly surprised by my research. It’s common knowledge, popular belief, historical fact, that the Republican Party is better for business, corporate profits, and the stock market – isn’t it?
Democrats are more interested in pushing socialistic programs at the expense of business – aren’t they? But wait a minute! Here's a look at the Dow’s gains and losses under Republican and Democratic Presidents over the last 50 years.

•Kennedy/Johnson (Dem) administration (1961-1965) - up 41.9%

•Johnson (Dem) administration (1965-1969) - up 8.1%

•Nixon (Rep) administration (1969 to 1973) - up 7.9%

•Nixon/Ford (Rep) administration (1973-1977) - down 0.1%

•Carter (Dem) administration (1977-1981) - down 4.1%

•Reagan (Rep) administration (1981-1985) - up 25.6%

•Reagan (Rep) administration (1985-1989) - up 79.0%

•Bush Sr. (Rep) administration (1989-1993 - up 52.3%

•Clinton (Dem) administration (1993-1997) - up 95.3%

•Clinton (Dem) administration (1997-2001) - up 67.3%

•Bush Jr. (Rep) administration (2001-2005) - unchanged

•Bush Jr. (Rep) administration (2005-2009) down 18.6%

•Obama (Dem) administration (2009 through Oct. 30, 2011) - up 36.3%

Over six Democratic terms the Dow gained 247.9%, or an average of 41.3% per term. Over seven Republican terms the Dow gained 147.1%, or an average of 21.0% per term.
Could it be? Over the last 50 years, investors have made almost double the returns under Democratic Presidents as under Republican Presidents?
I then went back 110 years to 1900. The same pattern emerged, although the difference was not as striking as it has been for the last 50 years.
From 1901 to 1961 the Dow increased an average of 36.7% per term when the president was a Democrat, and 32.1% when a Republican was in the White House.
The influence of one party or the other on the strength of the economy, business prosperity, and the stock market has clearly not been as popular wisdom suggests.

ANALOGY- US-ELECTIONS AND PERFORMANCE...

Presidential election cycle: Stocks and profits?


A market historian reviews the long-term pattern of stock prices and the Presidential election cycle.

By TheStockAdvisors on Fri, Jan 27, 2012 1:38 PM
By Jim Stack, Investech Market Analyst
What lies ahead in 2012? That’s the big question, and the fact that we’re approaching a Presidential Election likely improves the chances that this will be a good year for the stock market.
Historically, there has been a clear visible link between the Presidential election cycle and Wall Street. Below, we look at the correlation between cycles in the stock market and the 4-year election cycle.
Off-election years are often preceded by bear markets or stagnant growth and typically provide some of the best buying opportunities for stocks.
However, one rarely sees the market swooning in the 12 to 18 months leading up to a Presidential Election – 1960 and 2008 are the notable exceptions.
If you think about it, this relationship makes sense. Any politician worth his salt knows that you should try to get bad news and bear markets out of the way as quickly as possible after taking office. That way, the economy and the stock market can get back on track and be ticking along smoothly when it’s time to run for re-election. You rarely see Washington passing controversial tax hikes or legislation once the Presidential campaigns get rolling in earnest, and even the Federal Reserve, which is not supposed to be politically influenced, is reluctant to rock the boat.
Historically (since 1941), the first two years after a Presidential Election have the lowest performance, with average annual gains less than 5.5%.Year 3, as politicians start gearing up for re-election, is usually the best on Wall Street by a wide margin. With an average gain of 17.3%, it more than doubles the return of the other three years.
Presidential Election years tend to be more moderate, but historically are still the second most profitable in the cycle. Before the financial crisis, the average annual gain for election years was 8.9%; however, the 38% drop in the S&P 500 in 2008 reduced the long-term average to 6.2%.
The current 2009-2012 Presidential Election cycle is anything but “average.” After the 2008 debacle, the bull market recovery came early.
Years 1 and 2 were far stronger than usual, which likely stole performance from Year 3. Consequently, 2011 fell far short of expectations, ending with 0% gain in the S&P 500 after it suffered a sharp bearish contraction mid-year. Although the progression up to now has been atypical, what are the odds that this election year will be closer to the norm? In seeking the answer we looked back at prior cycles, where historical precedent has not always prevailed.
Election years can be volatile (what years can’t), but they rarely end with big losses for investors.
We looked at every Presidential Election year since 1900 along with the gain or loss in the DJIA (excluding dividends). Note that:
•The average gain for these 28 election years is 7.3%, which is equivalent to the average annual market gain taking all 112 years into consideration. However, if we exclude 2008, which was the worst Presidential Election year in over a century, the election year average jumps to 8.8%.
•Two-thirds of the periods were positive for the market, while years with major losses were rare.
•Election years that showed double-digit gains outnumber those with double-digit losses by nearly 3:1 – and only one of those double-digit losses occurred after 1940. That was in 2008 when the economy was deep in recession at election time (which was also the case in 1960), and it cost the incumbent party dearly at the polls. Our study also revealed another secret in Presidential Election years… the market often rallies in the second half of the year.
• In all but six election years, the DJIA either hit a new yearly high, or came within 5% of the year’s high, in the 4th quarter.
•There have been only five elections where the market dropped to a new yearly low in the 4th quarter, and three occurred during major recessions – 1920, 1932 and 2008.
•In 2004, the 4th quarter saw both extremes. The low was hit in October, and the DJIA rallied to its high for the year in December.Looking at 2012, the year has started off with good news on the economic front – leading data is improving along with confidence and recession fears are receding. Also, the technical picture is more encouraging, with stronger market breadth and the disappearance of bearish distribution.
In our opinion, this evidence, along with the Presidential Election Cycle, reduces the chance that this will be a down year for the market.
In our Model Portfolios, we are currently 77% invested, but we’ll likely step up from this level if fundamental and technical models continue to improve.

Thursday, January 26, 2012

INDIA CELEBRATED 63rd REPUBLIC DAY...


The World Congratulated, every INDIAN feel proud of the movement.

"The difference between what we do and what we are capable of doing would suffice to solve most of the world's problems" -Mahatma Gandhi

I believe the philosophy like " Work hard, make smart moves with Result Oriented Planned Efforts-approach to achieve your goals and differentiate with SUCCESS". 

My whole life revolving around the Indian Stock Market, ever since I started from 01-07-1987.

PEOPLE WHO MAKE THE DIFFERENCE......


HAPPY REPUBLIC DAY….


Amitabh Jhunjhunwala: Journey from a CA to Anil Ambani's top man

MUMBAI: It's not just blind loyalty that keeps Amitabh Jhunjhunwala and Anil Ambani together. Those who have seen the duo working together for years say it is a similar bent of mind that is responsible for the near-perfect fit. "There's nothing profound about his decision to follow Anil when the latter left Reliance Industries. Had he been an engineer, he would perhaps have continued with Mukesh," says a senior executive at the ADAG group. 
The two met for the first time in the early 80s when Jhunjhunwala, as cofounder of a CA firm, visited Reliance, one of his clients. Ambani was then in charge of finance. Ambani was impressed and, by 1993, persuaded the young CA to join a fund house brotherin-law Shyam Kothari had founded called Kothari Pioneer. 

A year and a half later, he came in as CEO of the newly-floated Reliance Capital, which started as a fund house and over the years transformed into a supermarket for financial services. Interestingly, Jhunjhunwala had co-founded the CA firm with Akhil Gupta, who is today to Bharti Airtel's Sunil Mittal what Jhunjhunwala is to Anil. Along with finance, the two share a passion for the entertainment business. 

That explains Anil's determination to get a foot into the door of Steven Spielberg's DreamWorks, the iconic Hollywood studio. Since that JV got underway , Jhunjhunwala has been closely involved with it; those working with him recall how he got misty-eyed when the studio received a letter from Neil Armstrong for the good restoration work of NASA's film on the first man stepping into the Moon. 

Yet, on many fronts, they're as different as cheese is from chalk. Whilst the professional keeps a cool head, the promoter is known to be excitable ; Jhunjhunwala is a light eater, the latter loves food; the former shies away from the limelight-he refused to comment to ET for this feature -- the chairman has thrived in it. Those who work around the duo point out that Ambani has played to Jhunjhunwala's strengths and accordingly given him responsibilities. 

For instance, his passion for human capital convinced the promoter to put him at the helm of businesses like media and entertainment and financial services. That gambit has worked at Reliance Capital, which with Jhunjhunwala as CEO diversified into life and general insurance; he also took Reliance MF to the top of the fund house sweepstakes. He built the entertainment business from scratch: the group acquired Adlabs in 2005. 

Now it's into radio, multiplex and film production. The creative and artistic bent may be courtesy of his mother, says a close friend of Jhunjhunwala, who was a journalist of repute, a Padma Shri awardee and an organiser of Kavi Sammelans at their Delhi residence. In fact, Jhunjhunwala even published a finance magazine called Money Matters for a year before he joined Kothari Pioneer. 

People who work with him at the entertainment venture say Jhunjhunwala looks forward to meeting Spielberg -- they meet least once a quarter -- and relishes the opportunity of meeting Hollywood stars who feature in DreamWorks' movies. Back home, however, the realities for the group are not all rosy. For starters, the combine has to find a way to reduce the mounting debt at Reliance Communications ; at last count it stood at Rs 39,000 crore, Rs 10,000 crore more than its top line and two times its market value. 
Their critics add that their record is far from unblemished on the finance front. For instance, they have not done any substantial acquisitions, although they attempted a few (the list includes two abortive attempts to buy South African telco MTN). Then, they may have overpriced the initial share of the group's power arm; and their mutual fund recently slipped to the No. 2 slot. 

The biggest challenge for the Ambani-Jhunjhunwala team is to prove that they are as good at executing projects as they are at spotting growth opportunities and raising capital for them -the group companies have some Rs 80,000 crore worth of infrastructure projects that have to be completed. For the next few days, however, Jhunjhunwala will be focused on one of the biggest projects of his personal life - the wedding of Abhinav and Prerna.
The article is very important to understand the future Indian Stock market shape...Please do read....

The Euro Zone crisis could mark the end of a paradigm adopted by the East Asian ‘Tigers', and later, China.
January 25, 2012: With the Euro Zone crises showing no signs of improvement and the prospect of recession confronting various member-states, how will the rest of the globe be affected?
The most obvious way was pointed out by the recently by WB and ADB in their respective outlooks for the global economy. In its Global Economic Prospects 2012 report, the bank urged developing countries to re-evaluate their “vulnerabilities' in the light of “dimming global growth prospects and the Euro debt problem.”
With surprising alacrity, India responded by admitting ahead of the Reserve Bank of India's third-quarter monetary policy review that the next two quarters could be “difficult”. For its part, the central bank stayed with its rates intact, but reduced CRR by 50 basis points to pump in liquidity. That was, at best, a symbolic gesture, because growth is decelerating, not so much on account of liquidity, but because, well, what is one to do with all those extra funds? Cash-rich firms are staring at a bleak policy environment, a bleaker investment landscape and scouting overseas or venturing sideways into acquisitions; but that won't add to the economy's overall corpus of productive investments.
In its global outlook for 2012, the Asian Development Bank repeated its pessimistic outlook for last year, reducing expansion yet again to 7.2 per cent for the East Asian region. As the Euro debt crisis deepens, the ADB warned, export-oriented nations in ASEAN, including China, would be affected, with lesser exporting nations becoming more vulnerable.
MODEL AT A CROSSROADS
What both the WB and ADB have cautioned against is the possibility of a full-blown financial and economic crisis; both wish policymakers in the region respond “decisively and collectively” to the crisis. Already, China, for instance, has recognised its own vulnerability, and is now ruefully examining the economy's structural imbalances.
The East Asian ‘tigers' or super-exporters are no less affected by the downturn in export demand. As recession kicks in with austerity measures in select Euro Zone countries, rising protectionism may compound the problems for East Asian super-exporters, warns ADB.
At a more fundamental level, what we may now be witnessing is a crisis in a development paradigm that had acquired the character of a synodal decree in the last three decades of the twentieth century.
The export-led growth strategy, first tried out by Japan following its post-WW-II reconstruction, rode roughshod on the extant import-substitution model that populist democracies like India had touted as the most appropriate model for developing countries. Exports inspired the success story of East Asian ‘Tigers' since the 1970s.
By the 1980s, the East Asian ‘tigers' had turned the export-led strategy into an inspiration for almost every developing country, confronting cumulative economic backwardness manifest in abundant, unproductive labour and non-traded goods in South-East Asia.
The ‘Tigers' — South Korea and Taiwan in manufacturing and high-tech, and Singapore and Hong Kong as global financial hubs — inspired the ‘tiger cubs', Malaysia, the Philippines, and Thailand, though with mixed success.
But it was when China stepped out in the latter half of 1978, virtually copying the model of export-centric industrial expansion line by line, that the model received its apotheosis.
Focusing on East-Asian policymaking as a key to its phenomenal success, Robert Wade's Governing the Market, in 1992, provided the most lucid and polemical statement of export-oriented growth in South Korea and Taiwan, with the state partnering markets in a synergistic allocation of resources to maximise productivity and output.
American and European expansion helped. In the 30 years to the end of the century, the export-led strategy catapulted nations with few natural resources, cheap and abundant labour, low industrialisation and lower per capita incomes, into high-powered economies and rising trade surpluses.
The strategy had a transcendental spin-off. Nations that were, in their early industrialisation efforts, scorned for poor quality, were now crowned with the reputation for quality at the best price: first Japan, then the East Asian economies and now, with its high-tech quality exports, China.
ZERO SUM GAME
In 2003, Thomas Palley of the Open Society Institute pointed to the dangers of a ‘demonstration effect' that was turning the export-oriented strategy into a zero-sum game by “poaching of domestic demand elsewhere, or by displacing exports of some other countries.”
As he wrote, “The evidence shows that there is significant cross-country crowding out, with exports to the US from the four East Asian tiger economies (Taiwan, South Korea, Hong Kong, Singapore) being subject to a large crowding-out effect from China.”
But export displacement wasn't a problem for the US or European consumers, who were just too happy with ever-cheaper products.
During the years, and on a global scale, an imbalance was working into flash points of newer tensions. The globe was now getting crowded with more exporters than were importers, more producers than consumers.
And it really began to pinch, when September 2008 set into motion an economic crisis that brought to the surface a simmering spat between China and the US regarding the latter's policy-driven exchange rate.
With a larger number of exporters and contracting import markets, the currency tension between China and US spread wider, since every exporting country wanted to retain a price advantage. Soon after 2008, when the effects of the Wall Street meltdown began to work into a recession, the US wanted even Germany to appreciate its currency; and when exporters didn't buy its argument, the US began “quantitative easing”, driving the dollar down.
RETHINK IN CHINA
The current economic crisis and its contracting demand for imports will strike at the very heart of the model of export-oriented growth, forcing a re-evaluation of its basic premise, even as policymakers contend with falling GDP rates down the line.
More so China than East Asia: in Beijing, policymakers may have already started pondering structural imbalances intrinsic to the growth model itself.
Director, China Centre for Economic Research, Yang Yao, says that owing to cheap labour and suppressed remuneration, returns from exports have flowed mainly to capital and to the treasury by way of tax revenues. Since the share of labour incomes has been declining, so has the share of consumption in GDP. Raising domestic demand may mean an inward-oriented strategy of growth.
That may sound familiar to Indian policymakers, but then there are only so many concepts to fool around with.
http://www.thehindubusinessline.com/opinion/columns/ashoak-upadhyay/article2831736.ece?homepage=true

Rosy looks.....


The makets are in jubiliance of FII inflow as the cash chasing the stocks is now unstopable. The markets are recovered from the lows and continue to consolidate at these levels for some time. Please do read my earlier postings in which I categorically said that the support at 4600-4500 for Nifty. Also mentioned that it doesn't matter whether it is 4400 or 4500. I recommended certain shares like Rel cap and RelInfra, most beaten down made a huge short covering rise, but people made lot of money.
Now the Nifty is well above the psycholical support of 4850-4900.The news flow will be good from now but the markets will ignore that to reflect in the price, but the news already priced in. The classic example is LT and BHEL. Now the news flow is -CAPITAL GOODS will do well infuture.
The RBI cut CRR ratse by 50 basis points is also a surprise to me. But the fact is that the market participants heavyly betted on the bull side that the RBI will make a rate cut atleast by 25 basis points.So there is a huge bonus. The liquidty in the system increased by 32000 crores is a good sign.I have my reservations at this point. The RBI is worried about growth rate and tight liquidity in the system but was encouraged by the falling inflation, gave confidence for a rate cut.
But the external market arround is not condussive to absorb the investments and make returns out of it. Then, the free availability of the cash may push for a bad investment decisions. As of now our growth at arround 7% is not a bad sign. So the RBI should have continued this tight CRR policy and used a OMOs for liquidity generation. The Open Market operations could have become as and when-infusion, rather than a blanket. Now our growth is surviving on the internal consuption and external dependency as usual. Now the markets are celebrating with Cheers!!!. Later the NPAs of banks will increase. The deffered/delay in payments will turn out to become as NPAs with cyclical effect that passes on from one sector to other and the industy will suffer badly.The Govt would have taken enough steps to boost the spending and would have generated some demand rather than allowing the industry to face the external music directly.
Now the markets are enjoying and will enjoy because of the short term euphoria of liquidity inflow and the STOP LOSS triggering. Techically the markets are now in bull grip. So long as SBI floats above 1860 level, the markets are in bull grip. The Nifty is enjoying the support of Reliance and the Banking majors. the only under prformer is HLL. I posted the reasons why HLL will under perform in my previous posting.The markets will be in bull grip due to DAVOS and in India at least till the first week of March-12.you know why?.....

Tuesday, January 24, 2012

cross roads but positive...


The Reliance results are disappointing but the buyback offer at 870 with more than 10,400 crores to purchase 12 crore shares. This is all to offset the bad news and keep the bears away. The history shows that Ambani family is not serious in buying. The RelInfra case of buy back is also became a joke. They promised to buy above 1200 but the stock came to 350 levels, the promoter himself did not subscribe to preferential issue. So they buy but they don’t. The new SEBI guidelines forces to buy at least 25% may whip for that portion.

The banking stocks are giving good results but the NPAs are increasing, seriously to alarming state. The following quarters will see more and across. The payment delays to defaults will start opening up. The good news is that the FII bought 1.16 billion dollars of stocks from Indian markets. They postponed in December, low valuations attracted, fueled by Rupee depreciation.

Technically speaking the strength of market to scale new highs is waning. The up move may get resistance at 5080-5180 for some time. The bottoms are well knit at 4830-35 and 4750-60 levels. So the bears also have limited opportunity to pull it down.

The Infy weak results, TCS is ok and Wipro is good likely to balance the tech sector as a whole. The Infy may !!!

Yesterday I couldn’t publish…..

Sunday, January 22, 2012


I AGREE WITH THE AUTHOR...I AM HAVING SAME VIEW IN INDIAN MARKETS????......

Is Wall Street manipulating this rally?

As traders push stocks slowly higher, blissfully ignoring all that's still wrong with the global economy, there's evidence that something is amiss.

By Anthony Mirhaydari on Fri, Jan 20, 2012 12:56 PM
Stocks inched up Thursday for the 10th day out of 12 trading sessions in 2012, pushing various technical indicators deeper into oversold territory and reaching levels not seen in many cases since late last April, when stocks were putting in their bull market high. Volume and breadth were pathetic. Up volume accounted for only 65% of total volume on the NYSE.

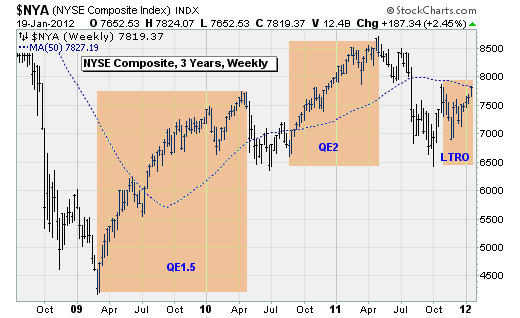
All that matters, apparently, is that the European Central Bank dumped just over €200 billion in three-year money into the system a few weeks into a long-term refinancing operation to supply capital to banks. While not exactly like the quantitative easing done by the Federal Reserve a few times, this LTRO looks, smells and tastes just like the Fed's QE1 and QE2 to the Wall Street fat cats worried about their bonuses.

And they're using every trick in the book to juice the market higher. But here's the thing: Regular investors aren't buying what Wall Street is selling.

Just look at Thursday's action.

Investors ignored a batch of mostly bad news. There was a disappointing Philly Fed manufacturing report. Greece continued its efforts to negotiate a voluntary debt reduction with its bondholders, many of whom, as you know, are hedge funds that have undertaken a "basis trade" using credit default swaps and are poised to cash out no matter what happens (and therefore have an interest in holding out for the absolute best possible deal).

And there was some disappointing earnings news, too, in what is shaping up to be the worst earnings season (based on positive earnings surprises) since 2001, according to Sundial Capital Research. 

In response, Wall Streeters are buying now, asking questions later, and are beginning to foam at the mouth as they push their bets to try to encourage a buying frenzy. This, in turn, is pushing sentiment measures based on things like options trading, analyst sentiment or the relative volume in the Nasdaq vs. the NYSE to extremes.

Boy, are they pushing. TrimTabs compiled a list of data points showing the extreme optimism on Wall Street:
  • Short interest at New York Stock Exchange members plunged 10.5% in December to the second-lowest level of the past two years.
  • Options traders are growing more complacent. The put-call ratio averaged just 0.81 on the past five trading days, the lowest five-day average since July 2011. 
  • The VIX fell to 20.5 on Jan. 12, the lowest level since July 2011.
  • Of the hedge funds TrimTabs surveyed in cooperation with BarclayHedge in December, 42% were bullish on the S&P 500, while 30% were bearish. That level of optimism was the highest since July 2011.
  • Investors Intelligence reports that 51.1% of newsletter writers are bullish, the highest level of optimism since April 2011, when the U.S. stock market topped out.
  • Bank of America's survey of global fund managers found that asset allocators are more bullish on U.S. stocks than at any time since April 2010.
Despite all this, average investors are staying on the sidelines. TrimTabs estimates that U.S. equity funds have received only $3.3 billion in new cash so far this month, which is historically a very heavy month for inflows. Compare that with the $932 billion that flowed into checking and savings accounts, eight times the $117 billion that went into stocks and bond funds as well as ETFs.

Thus the low-volume, narrow-breadth, low-volatility grind higher we've witnessed so far this month. But here's the thing. The half-life of extraordinary monetary policy efforts is falling fast. Very fast.

It lasted for a year starting in March 2009 -- that was QE 1.5, when efforts announced in November 2008 were expanded -- thanks to the tailwinds from the market discounting the end of the recession and the end of the financial crisis. It lasted about seven months when QE2 was teased in August 2010 and was helped by the calming of the eurozone crisis after the first Greek bailout.

Now we're already in the third month of this new European variety of central bank largess.

Yet the economy faces a number of headwinds that are not going away: There are sovereign debt issues, fiscal austerity, rising trade protectionism, the debt-ceiling debate, the rise and fall and rise again of crude oil, a stalling of earnings growth, a whiff of inflation, moribund banks, a spate of elections, and mixed economic reports with sentiment high but job growth and housing still anemic.
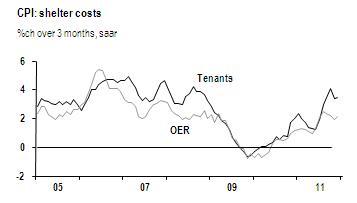
Until this dynamic changes, we're stuck in the mud. The Fed, or the ECB, might try to pull us out with lifelines of cheap cash -- but that is now just making the problem worse by fueling inflationary concerns. Just look at the rise in shelter costs due to a tight rental market, a major component of the Consumer Price Index.

Wall Street isn't looking that far ahead, I guess. But folks on Main Street, the ones who are watching at-the-pump prices rise again as those holiday bills come due, or are trying to find a nice rental home, already know what's coming. And it's not good.

Tuesday, January 17, 2012

A MATTER OF JUSTIFICATION!!!!!!!!!!!!!!!!!

TO UPWARD MOVE NEGATIVE NEWS IS ALSO USEFULL

BECAUSE...... A MATTER OF JUSTIFICATION!!!!!!!!!!!!!!!!!

China’s Slowest GDP Growth in 2 1/2-Years Boosts Scope for Easing: Economy


By Bloomberg News - Jan 17, 2012 1:47 PM GMT+0530
China’s economy expanded at the slowest pace in 10 quarters as Europe’s debt crisis curbed export demand and the property market weakened, sustaining pressure on Premier Wen Jiabao to ease monetary policy.
Gross domestic product rose 8.9 percent in the fourth quarter from a year earlier, the statistics bureau said in Beijing today. Growth exceeded the 8.7 percent median of 26 estimates in a Bloomberg survey, staying above the 8 percent that signals a “soft landing” for China, according to SinoPac Financial Holdings Co., which correctly predicted the GDP number.
Asian stocks rose on speculation policy makers will ease lending curbs and increase fiscal spending to bolster the world’s second-biggest economy. Liang Wengen, China’s richest man and chairman of Sany Heavy Industry Co., told Wen this month that construction-machinery demand is weak and called for more infrastructure investment.
“Decelerating GDP growth will provide more room for policy makers to shift towards a pro-growth bias after an extended tightening cycle,” Jing Ulrich, chairman of global markets for China at JPMorgan Chase & Co., said in a note after the data. “At this juncture, the challenge for policy makers is to implement measures that boost domestic demand without setting back progress made in curbing inflation.”
The Shanghai Composite Index (SHCOMP) climbed 4.2 percent today, the most since October 2009, on expectations for more monetary easing and on speculation the government will support equities. The MSCI Asia Pacific Index gained 2 percent at 5:14 p.m. in Tokyo.
Property Meltdown Risk
Full-year economic growth slowed to 9.2 percent from 10.4 percent in 2010, today’s report showed. Industrial production increased 12.8 percent in December from a year earlier, more than the median estimate of 12.3 percent in a Bloomberg survey and a 12.4 percent increase in November. The economy grew 2 percent last quarter from the previous three months, when it expanded 2.3 percent.
China is prepared for a slowdown in economic growth and a mild moderation is “desirable,” Ma Jiantang, head of the statistics bureau, said at a briefing today. The government has set a target of 7 percent annual expansion for the current five- year plan that runs through 2015 and will focus more on the quality of growth, he said.
“The data confirmed no hard landing is likely, more so given the loosening stance already adopted by the policy makers,” said Shen Jianguang, Hong Kong-based chief greater China economist for Mizuho Securities Asia Ltd. Still, there is “no room for complacency, given the risks of a property sector meltdown and global crises,” said Shen, who expects further relaxation in credit, an expansionary fiscal policy and loosening in the property sector in the second quarter. ......contd.........

Pls visit for further reading......

http://www.bloomberg.com/news/2012-01-17/china-gdp-expands-at-slowest-pace-in-10-quarters-may-prompt-policy-easing.html
 
FOR NOW ENJOY THE BULL RUN ACCROSS THE GLOBE.......DESPITE THE RATE CUTS,
GLOOM IN THE EUROPE GROWTH....BUT....


 Slash your expectations: RBI to investors

AGENCIES

Posted: Monday, Jan 16, 2012 at 1924 hrs IST

Hyderabad: Indian bourses have started to display positive signs, but investors need to scale down expectations of returns on their capital to avoid creating imbalances in the system that will result in financial instability, RBI Deputy Governor K C Chakrabarty said today.
"People who are trying to invest in India, who are investors, they have to scale back their expected return on capital otherwise there will be imbalance and it will create more problems," Chakrabarty told reporters on the sidelines of a function at the Jawaharlal Nehru Institute of Banking and Finance here.
"... Every day the Sensex cannot give a 30 per cent return on equity. There has to be a relationship between debt and equity. But when the overall debt comes down, return on equity has to also come down," he said.
Replying to a query on the liquidity position in the country, the RBI deputy chief said the central bank is happy with the situation.
The apex bank has increased key policy rates 13 times since March, 2010, to tame high inflation.
However, it took a pause on the hawkish monetary stance at its policy review last month as inflation started cooling down.
Chakrabarty refused to answer requires related to inflation and rupee depreciation against the US dollar, saying these will be answered at the RBI's forthcoming monetary policy review on January 24.
The Reserve Bank of India official said there are two fundamental imbalances all over the world that need to be resolved to avoid financial instability.
Explaining the imbalances in the financial system, he said one is the cost of capital and the second is that in any economy, the rich must save and the poor must borrow.
"The second issue is that in any society which has to develop, which has to prosper, it is the rich (that) must save and the poor must borrow. Today, the world-over, economies are such that the rich borrow and poor save. If the rich borrow, it becomes inefficiency. If the poor borrow, it becomes efficient and more productive," he said.
According to him, India does not contribute to any such imbalance.
Earlier, in his speech titled, 'Crisis Management in Interconnected Markets', Chakrabarty said the best crisis management framework is one that prevents crisis and no financial system can be completely immune from episodes of financial instability from time-to-time and there will be a need to manage crises.
"There are important lesson to be learnt from each crisis. Yet, we can count on each crisis to be sufficiently different from every other crisis so as to make their identification a challenge. We can but be alert and flexible to evolving risks," the banking regulator said.
In India, an early intervention system in the form of prompt corrective action based on three indicators – capital to risk weighted assets, non-performing advances and return on assets -- has existed for a long time, he added.

Thanks to Financial Express...

Sunday, January 15, 2012

S&P RATE CUT- AXE ON FRANCE????


THE INDIAN MARKETS RELENTLESS FALL DESPITE OF 7-8% GROWTH!!!!!!!!!

BECAUSE THE GROWTH HAS EXTERNAL DEPENDENCIES....LIKE...OR DON'T LIKE....

THANKS TO BUSINESS LINE....

For now the rise of hopes has been spooked by the rate cuts of EURO zone nations. The France and Astria and other nations credit ratings were stripped down. There are 19 nations on the negative watch list.

The borrowing cost of the Sovereigns and the Companies will increase, leads to a vicious cycle of pressure and failure impacting the performance of the companies, the workers and the nation as whole.

The fear factor of DOWN grade, in the spines of our FM and Japan PM, calling for fiscal prudence.

So our markets may take longer period to cope up with the external pressure, may cap the rise and the speed of recovery. For now the the bottoms are in place but sustained pressure can make the fissure wide-open for a free fall.....